Indice del volumen Volume index
Comité Editorial Editorial Board
Comité Científico Scientific Committee
- Traditional methods for nonlinear approximation are of little use if are applied straightforward for simultaneous parameter estimation from the beginning of an epidemic outburst.
- Properly transforming cumulative data can provide good initial estimates for the time to peak as well as for the basic reproductive number.
- Initial estimates of the total number of cases have only an orientative value, and can be between a half and the double of more reliable estimates.
- Stepwise use of classical approximation methods can yield acceptable estimates at the beginning of an outburst.
- The following parameters were predicted from the USA H1N1 cumulative cases data:
- Time to peak=32 days (19th of May)
- R0 close to 1.7
- Total number of cases 20000 (Ranging from 9000 to 48000, and being close to 10000 on may 21st)
ATTEMPTING TO PREDICT THE FATE
OF AN ONGOING EPIDEMIC.
LESSONS FROM A(H1N1) INFLUENZA IN USA.
José Luis Hernández Cáceres, Karel Vazquez Argote1,
Reyder Risco Soria, Miguel Martín Martínez
Center for Cybernetics Applications to Medicine, Havana Higher Institute of Medical Sciences. Ciudad de La Habana.
1Dirección Provincial de Salud. Victoria de Las Tunas.
Cuba.
cacerjlh @ infomed.sld.cu
Rev Electron Biomed / Electron J Biomed 2009;2:38-48
Comment of the reviewer Prof. Fernando Tricas García. PhD in mathematics. Professor of Languages and Systems. Department of Computer and Systems Engineering. University of Zaragoza. España.
Comment of the reviewer Prof. José María Eirós Bouza. Professor of Microbiology, Faculty of Medicine, University of Valladolid. Head of Virology, Hospital Clínico Universitario. Advisory Committee of the WHO Influenza. Member of Working Group National Influenza Center. España.
RESUMEN:
Se hace un intento de estimar los parámetros más importantes del brote de influenza A(H1N1) en los Estados Unidos de América en 2009 sobre la base de la información pública emitida por los Centros para el Control de Enfermedades (CDC) norteamericano durante los días iniciales de la epidemia. Por tratarse de un problema estadístico mal planteado, se combinó la estimación no lineal (método de Gauss-Newton y de Hooke-Jeeves) con procedimientos de linealización que permitieran establecer un conjunto adecuado de valores iniciales para comenzar la estimación recursiva de los parámetros.
Sobre la base de los datos disponibles hasta el 13 de mayo de 2009, se predicen los siguientes valores para el brote en los Estados Unidos. Tau (tiempo hasta el pico de incidencia) 32 días; R0 (numero de infecciones secundarias por individuo infectado)1.7; K (numero total de casos) 20000 (15000-35000). Estos resultados concuerdan con lo reportado por el "WHO's Rapid Assessment Team" para la epidemia en México. El método puede aplicarse en cualquier locación donde se registren adecuadamente el número cumulativo de casos de una epidemia o brote.
PALABRAS CLAVE: Inluenza A(H1N1). Modelos Matemáticos para epidemias. Predicción de la evolución de un brote.
SUMMARY:
An attempt is made to estimate the main parameters of the 2009 Influenza type A(H1N1) outburst in USA based on public information provided by Centers for Disease Control (CDC) during the early stage of the epidemic. Given the ill-posed nature of the statistical problem, a nonlinear fuction estimation method (Gauss-Newton and Hooke Jeeves) was combined with linearization procedures that allowed to set adequate initial guess values for estimation.
Based on data until May 13th, 2009, the following values are predicted for the USA outbreak: Tau (time to the peak of incidence) 32 days; R0 (number of secondary infections per infected individual) 1.7; K (total number of cases) 20000(15000-35000). These results are in good agreement with the values reported by the WHO's Rapid Assessment Team for the outburst in Mexico. The method can be applied in any setting where cumulative number of cases are properly recorded.
KEY WORDS: A(H1N1) Influenza. Mathematical models for epidemics. Outburst evolution prediction.
INTRODUCTION
HIV/AIDS, Ebola, SARS, Avian Flu, and the Swine Flu A(H1N1) are examples of infectious diseases, completely unknown to the human immune system, that appeared in the last years. The dates of appearance of these cited above suggest that in the next ten years al least several new similar scenarios will emerge1.
It is uncertain whether public health systems are ready to face a pandemic of a new disease2. Evidences from the spread of AIDS in Southern Africa, to just present an example, cast doubt on a positive answer.
Among the questions that are important for individuals, public and authorities there is the prediction of an ongoing epidemic3. SARS affected more than 7000 persons worldwide4, whereas H1N1 probably will surpass that number several times5.
A crucial issue on an ongoing epidemic is to have estimates for values such as the expected total number of cases, the moment when the peak will be attained, as well as the number of persons infected by a single primary case6.
Public health services are mobilized the very first days of an outbreak, since early planning is decisive. Unfortunately these are the days when the prediction is poorest; from the large number of models that could be used all of them are highly nonlinear, and having few data points can lead to false values, and subsequently, spoil the whole process of resource planning.
A very important point is which model to select for making the approximations. With available computer technology models can be as complicated as wished, and literature can provide wide evidence on that point7.However, when little is known about the mechanisms of the ongoing disease, it is advisable to select the simplest models being capable of adapt to different possible variants. Picking a complicated and shrewd model in this case is comparable to the well known case of attempting to describe the growth curve of a dog with a miligram-precision scale.
At the same time, experience shows that for a large variety of models, the incidence I(t)during an outburst can be nicely approximated by the following function, that was proposed 70 years ago by Kermack and McKendrick as an fairly accurate solution to their seminal "SIR" model8.
I(t)=A*sech2(Bt-C) (1)
In this case A gives the peak value of incidence, that appears at time Tau= C/B
If the dates of onset of cases are properly documented, this can be a good candidate function to be fitted.
Thus, for the H1N1 outbreak in a New York school in April 2009, where epidemiological information was under strict scrutiny9, a good approximation was obtained applying a Gauss-Newton algorithm to model (1) (fig 1). This school-based outbreak is the largest cluster of H1N1 flu cases reported in the United States thus far, and indeed is a valuable source of information.
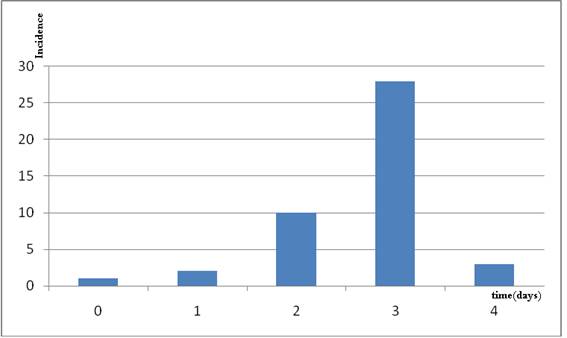
Figure 1. Data from an H1N1 outburst in a school in New York in April 2009.
Data were fitted with model (1) yielding the following values A=30.93 (vs. 28 observed) B=1.48 C=4.11; C/B=2.77
(vs. the observed value of 3). 99.43% of the variance was explained with the model.
However, it is difficult to have reliable data about real incidence in practical situations. Thus, from the 642 cases reported between April 15th 2009 and May 5th 2009 in the US, it was possible to identify the date of the onset of symptoms only for 394 patients (61%) 10. In places with more fragile health infrastructure no better reliability is to be expected.
It seems preferable to use cumulative data S(t), for which the Richards model can be valid 2:
S(t)=K/(1+exp(r(Tau-t))) (2)
K corresponds to the total number of cases and equals
K= (S(0)*(1+exp(r*Tau)) (3)
Tau has the meaning of the peak time for incidence, and the basic reproductive number R0 (defined as the average number of secondary cases generated by one primary case) can be estimated as
R0=exp(Tg*r) (4)
Where Tg is the transmission time, or the mean time between the appearance of symptoms in the primary case and the appearance of symptoms in a secondary case 2. To use for assessing an epidemic cumulative confirmed cases data presents several limitations, including the lag between starting of the window of viral shedding and the laboratory report, as well as complications related to the uneven speed of laboratory confirmation of suspected cases, but there are reasons to assume that these are the best data publically available at this moment.
The other limitation is due to finding parameters from a data set that obviously is not the best suited for "academical" approximation purposes. For illustration, on how difficult this task can be, in figure 2, the best expected prediction for the Richards model is represented in the solid blue line whereas the cumulative cases numbers for USA until (12 of May, 2009) are represented as red crosses.
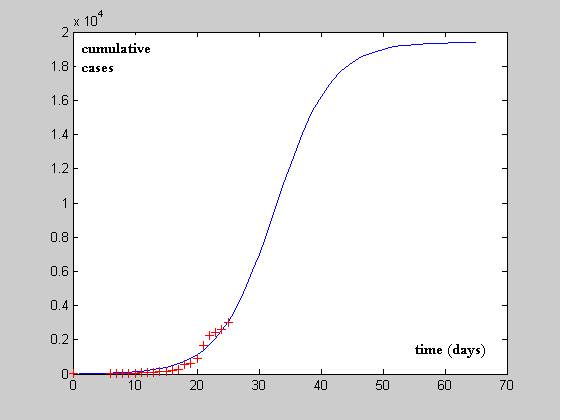
Figure 2 CDS confirmed data for USA since April 21 2009 until May 12th (+) and
putative evolution curve estimated using the methods described in this paper (solid blue line)
There are several approximation methods to fit nonlinear data into models, such as Simplex, Hooke-Jeeves, Gauss-Newton, that have been implemented in different commercial statistical packages. These allow, in principle to simultaneously estimate several parameters from a data set. However, straightforward estimation beyond the domain of observed values with a highly nonlinear function, is not always reliable. Thus for the case of USA A(H1N1) data set, estimates for k, using all parameters at a time, yielded values of k equal to 160000, 3241 or 6217 in all the three cases showing "excellent" fits with explained variances higher than 95%. In other words, data are behaving as those typical for ill-posed inverse problems. A practical way to try to deal with this kind of problems is limiting the space of possible solutions, and imposing the solutions certain plausible requirements. In this case, the use of linearizations and manual stepwise estimation of values seems to be recommended.
We are testing this approach in the case of H1N1 cases confirmed by CDC until May 13th, 2009 (Figure 1)
The first attempt to linealize data is as follows. If r(Tau-t)>>1, the inverse of (1) can be seen as
1/S~exp (r(t-tau)),
From a Taylor expansion of the exponential function till the fourth power, it can be obtained the following approximation for the fourth root if the inverse of S(t)
(1/S(t))^(1/4) ~ -(r(t-tau))
The right side becomes equal to zero when t=Tau; thus from the relationship between the inverse of the cumulative data and elapsed time, it is possible to obtain a good guess for the time to the peak of the outburst.
As it can be seen from Figure 3, data for USA fit well into this approximation and a guess value for Tau= 32.56 is assumed
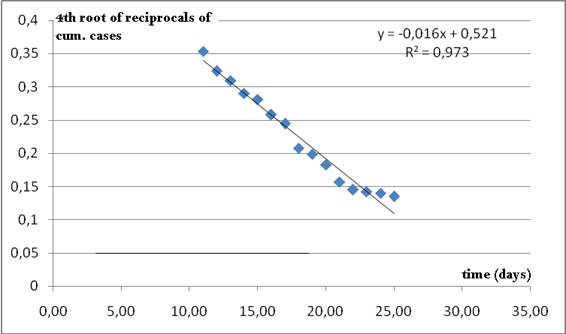
Figure 3. Nearly linear relationship between the fourth root
of the reciprocals of cumulative data and time. The time when the line crosses the axis of abscissas
is taken as a rough initial estimate for Tau in Richards model (2).
This seems to be a reasonable guess, since cumulative data are increasing after 27 days from the onset of the outburst.
Inspection of (1) suggests that a nearly linear relationship must be between ln(S) and time.
In this case the intercept will depend on all the 3 parameters of the model and has little practical use. However, the slope can bring a good initial estimate for r.
As it can be seen from figure 4, a value of r= 0.324 is suggested.
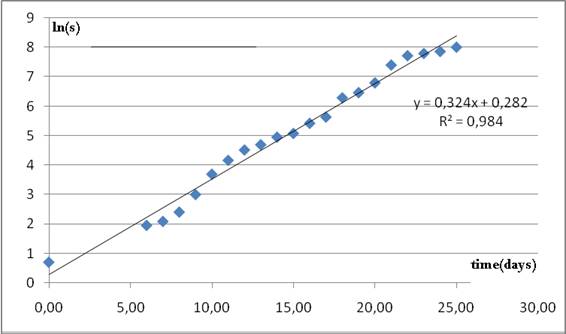
Figure 4. Nearly linear relationship between natural logarithm of cumulative cases and time.
The slope of the regression line is taken as a guess value for parameter r in model 2.
If a value of generation time Tg=2.3 is accepted as the most plausible for H1N1 11,12, this suggests a value of R0=2.1, which is in agreement for the first early report in the range of R0=1.4-1.6 made for H1N1 in Mexico5.
Since S0=2, from expression (3) it can be obtained, a value of k=56004 cases. Obviously, the power function (3) is very sensitive to errors in the estimates. Refining the approximation can provide a more reliable datum.
If these values were true, we must see the peak of incidence on May 21st, the basic reproductive number (R0) is 2.1 which is similar to the value of 1.4-1.6 reported by the WHO rapid assessment team for Mexico5, and about 28.000 cases will be reported for May 21st.
Having these initial estimates, a refinement can be found using a nonlinear function estimation method such as Gauss Newton or Hooke-Jeeves.
For coming to the final value we recursively refined the model's parameters. For that, we started with the two estimates obtained from linearization and applied the Gauss Newton algorithm to estimate k. After this the estimation procedure was repeated each time feeding the model with new updates for several times (from 4 to 19). The stop criteria were the highest explained variance with reliable estimates and similarity in subsequent estimation of parameters. In this example, the explained variance rose from 92% to 96%.
The following "final values" were found:
Tau=32.65 days
r=0,232
K=19826
96% of the variance explained.
This corresponds to an estimate of R0=exp(2.3*0.232)=1.7, which is closer to the above mentioned estimate obtained by the WHO Rapid Assessment Team for Mexico.
In Mexico, an estimate of 23000 cases (between 6000 and 32000) has been reported for parameter K. Due to the similarity in population between the two countries, our estimate seems to be in agreement.
Publically available information from the Centers for Disease Control13 also allow studying data from different states.
In table 1 data for some states are provided based on reports until May 15th, 2009. The agreement between values of r is noticeable.
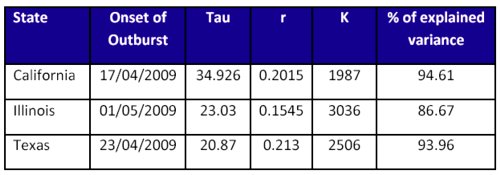
Table 1. Estimates obtained from H1N1 cumulative data
until May 13th for 4 different states from USA.
Early estimates
The main question we are addressing here is how reliable it can be an estimate obtained from early data of an outburst. Apparently, comparing the evolution of estimates as the outburst proceeds can help in clarifying this question.
We analyzed, starting from day 7 from onset (with only 3 values) how different parameters looked like. It should be payed attention to the fact that the second report was 6 days after the first report, thus on the day 7th only 3 data points were available. This would suggest that early estimates can have only a very rough approximative value, but, in any case, are of great value when very little is known about the epidemic.
In figure 5 it can be appreciated that predictions for Tau close to 30 days appear since day 12 (with only 8 data points available). From all observations the mean and standard deviation for Tau were 31.0±5.2
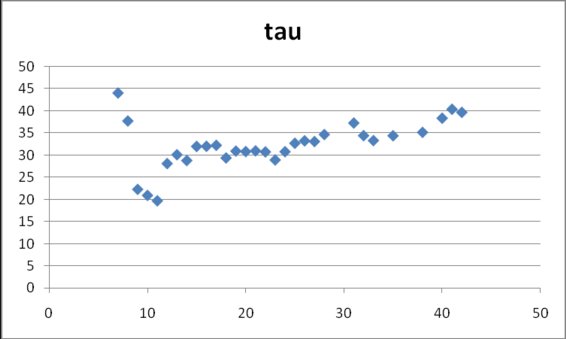
Figure 5. Estimates for Tau in model (2)
obtained from cumulative data gathered at different dates after the onset
of data collection on April 17, 2009.
In figure 6 values for parameter r are shown. After day 12 the parameter keeps nearly constant values around 0.33 and at the end they go to smaller values, below 0.20 (0.31±0.12).
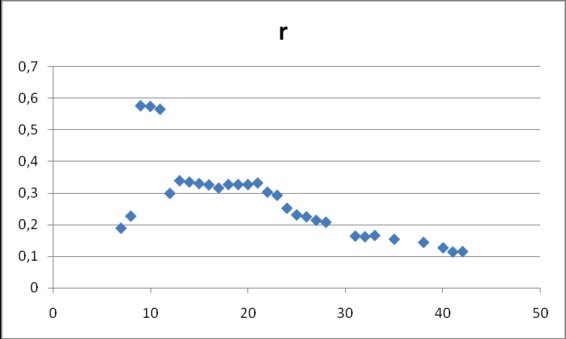
Figure 6. Estimates for r in model (2) obtained from
cumulative data gathered at different dates after the onset of data collection on April 17, 2009.
Finally, the parameter K (fig 7) takes values between 5000 and 50000, with an apparent tendency to lie between 10000 and 20000 on later days (25294±11965).
The full set of values is in table 2
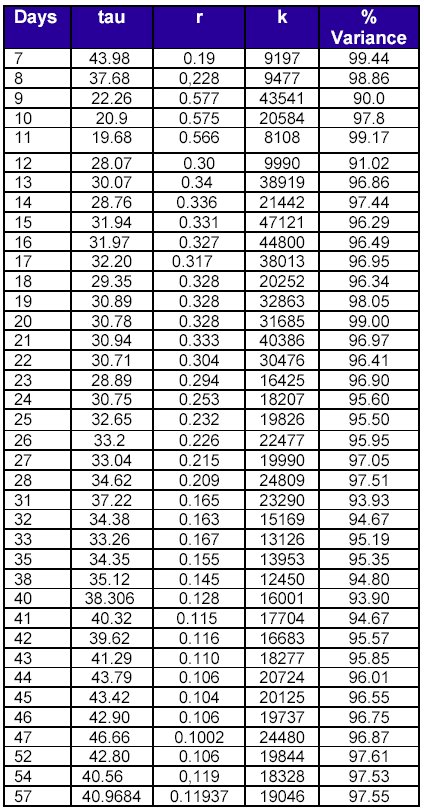
Table 2. Evolution of parameters estimates
for US H1N1 cumulative data as the outburst proceeds.

Figure 7. Estimates for k in model (2) obtained from cumulative data
gathered at different dates after the onset of data collection on April 17, 2009.
DISCUSSION.
Overall, these results suggest that USA H1N1 data may be described with the Richards model, and reliable estimates for both the peak of incidence as well as for R0 can be obtained from early data.
If we accept the value of Tau=38 as a true value, our results suggest that with as little as 6 observations, corresponding to less than half of Tau, quite acceptable estimates were observed for all the three parameters.
The estimates for the total number of cases give only rough orientation using this approach, but judging by the ample interval of possible values provided by the WHO Rapid Assessment Team, it seems that better precision is difficult to be attained. The simplest explanation for this fact comes from the errors in Tau and r. Since K depends on the exponential of the multiplication of these two parameters, a high span of values can be observed, in this sense, changing by a factor of 4 from lowest to highest value is not a very large dispersion.
There are large data sets about epidemics that have been modeled using different approaches, and valuable conclusions were drawn from them. However, the case when few data are at hand and it is necessary to maximally squeeze information from them is not uncommon in many places. This report has been an attempt to address this last situation.
We assume that due to the simplicity of this method and its possibility to bring early estimates of important parameters, its implementation could be of use practically in any setting where data can be properly collected.
The general Model of Richard includes a sigmoidicity parameter that apparently changes while analyzing real data. In USA flu data this parameters is practically 1 (0.999307 with 96.75% of explained variance when 35 data points corresponding to the fist 45 days of the outbreak were analyzed), which substantiate the choice of the simple version of the model.
CONCLUSIONS
ACKNOWLEDGEMENTS
Authors would like to express their gratitude to the following professors for their valuable suggestions: George Duncan, Alicia Juarrero, Tomas Johnson and Mario Estévez. MSc. Sonia Hernández Camacho contributed with a in-depth revision of the manuscript.
REFERENCES
- 1. Graeme Laver and Elspeth Garman. The Origin and Control of Pandemic Influenza. Science 2001:293:1776-1777.
2. Richard Coker. Swine flu. Fragile health systems will make surveillance and mitigation a challenge. BMJ 2009;338:b1791. Published 30 April 2009, doi:10.1136/bmj.b1791
3. World Health Organization. Epidemic and Pandemic Alert and Response (EPR). Assessing the severity of an influenza pandemic. 11 May 2009
4. Zhou G, Yan G. Severe acute respiratory syndrome epidemic in Asia. Emerg Infect Dis. 2003;9:1608-1610.
5. Fraser C, Donnelly CA, Cauchemez S, Hanage WP, Van Kerkhove MD, Hollingsworth TD, Griffin J, Baggaley RF, Jenkins HE, Lyons EJ, Jombart T, Hinsley WR, Grassly NC, Balloux F, Ghani AC, Ferguson NM, Rambaut A, Pybus OG, Lopez-Gatell H, Apluche-Aranda CM, Chapela IB, Zavala EP, Guevara DM, Checchi F, Garcia E, Hugonnet S, Roth C; The WHO Rapid Pandemic Assessment Collaboration. Pandemic Potential of a Strain of Influenza A (H1N1): Early Findings. Science. 2009 May 11. [Epub ahead of print]
6. Cohen J, Enserink M. Infectious diseases. As swine flu circles globe, scientists grapple with basic questions. Science. 2009;324:572-573.
7. Riley S. Large-Scale Spatial-Transmission Models of Infectious Diseases. Science 2007;316:1298-1301
8. Kermack WO, McKendrick AG. Contributions to the mathematical theory of epidemics. Proc Royal Soc A 1927;115:700-721.
9. CDC MMWR dispatch. Swine-Origin Influenza A (H1N1) Virus Infections in a School - New York City, April 2009. April 30, 2009 / 58(Dispatch);1-3
10. Novel Swine-Origin Influenza A (H1N1) Virus Investigation Team. Emergence of a Novel Swine-Origin Influenza A (H1N1) Virus in Humans www.nejm.org May 7, 2009
11. Center for Disease Control. Interim Guidance for Clinicians on Identifying and Caring for Patients with Swine-origin Influenza A (H1N1) Virus Infection May 4, 2009 4:45 PM ET. Available at Available at http://www.cdc.gov/h1n1flu/identifyingpatients.htm
12. Carrat F, Vergu E, Ferguson NM, Lemaitre M, Cauchemez S, Leach S, Valleron AJ. Time lines of infection and disease in human influenza: a review of volunteer challenge studies. Am J Epidemiol 2008;167:775-785
13. Center for Disease Control. H1N1 Flu. Available at http://www.cdc.gov/h1n1flu/